
Cracking the Mutual Fund Code: Discovering the Ultimate SIP Investment
Roadmap to Smart and Sustainable Wealth Growth

In the financial industry, one question echoes louder than most: "Which mutual fund should I invest in?" It's a seemingly simple query, yet the answer remains elusive amidst the complexities of market dynamics. We often find ourselves wrestling with recency bias or resorting to analytical frameworks, throwing around terms like "risk-adjusted return" or citing the latest high-performing fund, hoping to uncover the next big opportunity. But do any of us truly possess the definitive answer?
Let's be candid: I too have my biases. I have always advocated for an equal-weighted strategy encompassing Nifty 50, Nifty Midcap 150, and Nifty MidSmallcap 400 Indices. Why? Because in a landscape fraught with uncertainty, relying solely on predictions of economic or psychological variables feels akin to gambling. Hence, I propose a solution rooted in probabilities rather than absolutes.
Recently, I decided to put my hypothesis to the test. My goal? To determine whether selecting a mutual fund scheme is a reliable endeavor or if blind faith in a synthetic equal-weighted ETF might be the smarter move.
Methodology:
Identifying the best mutual fund scheme available today.
Contrasting its performance with a synthetic equal-weighted ETF.
Drawing conclusions.
My hypothesis is straightforward: No equity scheme can consistently sustain a top-ranking position in terms of yearly returns over an extended period. To keep the analysis pragmatic, I opted for simplicity over complexity, sidestepping convoluted metrics like Sharpe ratios and alphas.
Here's how I approached it:
I commenced by scrutinizing funds with at least a decade of NAV data. Out of 108 distinct equity growth schemes, merely 54 had secured a top 10 spot at least once in the past decade (CY14-23). However, a mere 5 funds managed to maintain a top 10 position four times or more. This underscores the inherent risk of relying solely on past performance to guide investment decisions.
Schemes ranking as per yearly point-to-point returns
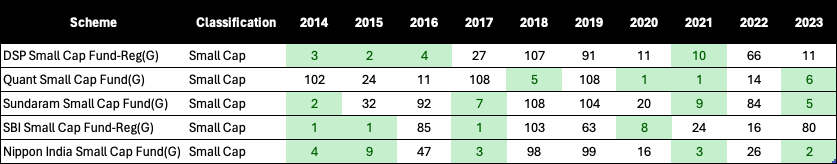
Surprisingly, amidst the unpredictability, one standout emerged: Nippon India Smallcap, which featured among the top 10 ranking schemes five times in the last decade. The remarkable consistency begs further examination, perhaps shedding light on exceptional fund management practices.
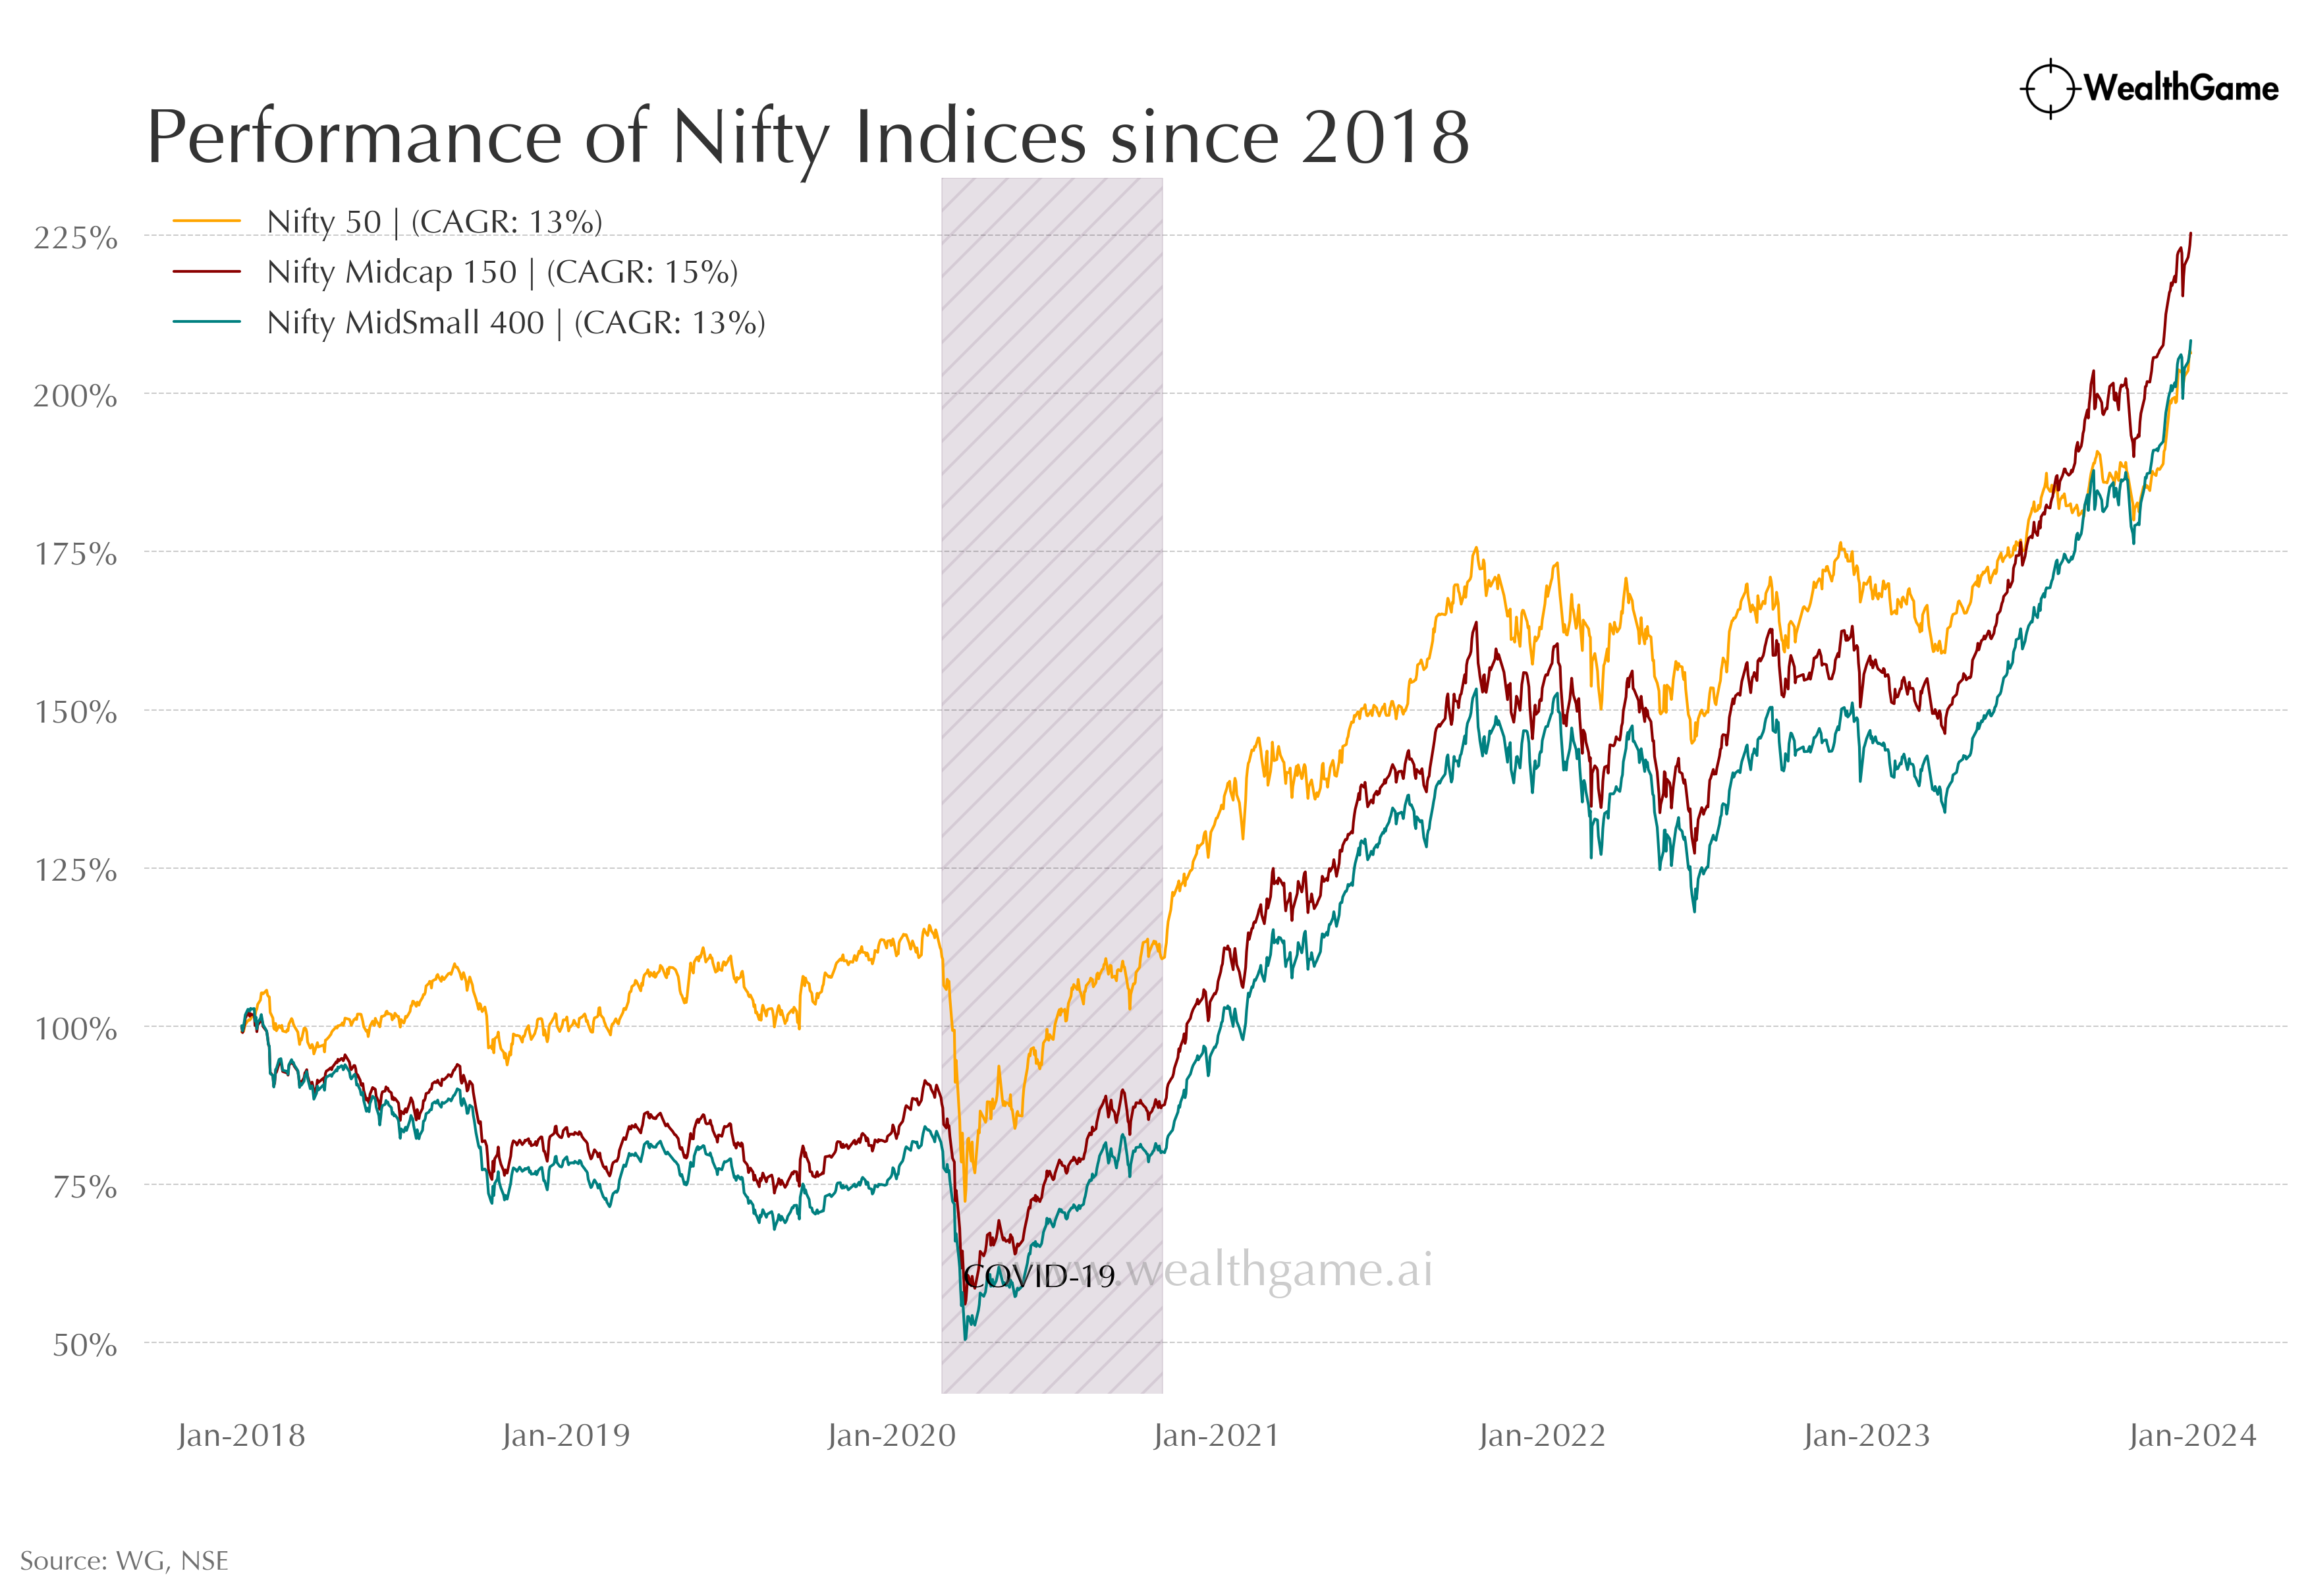
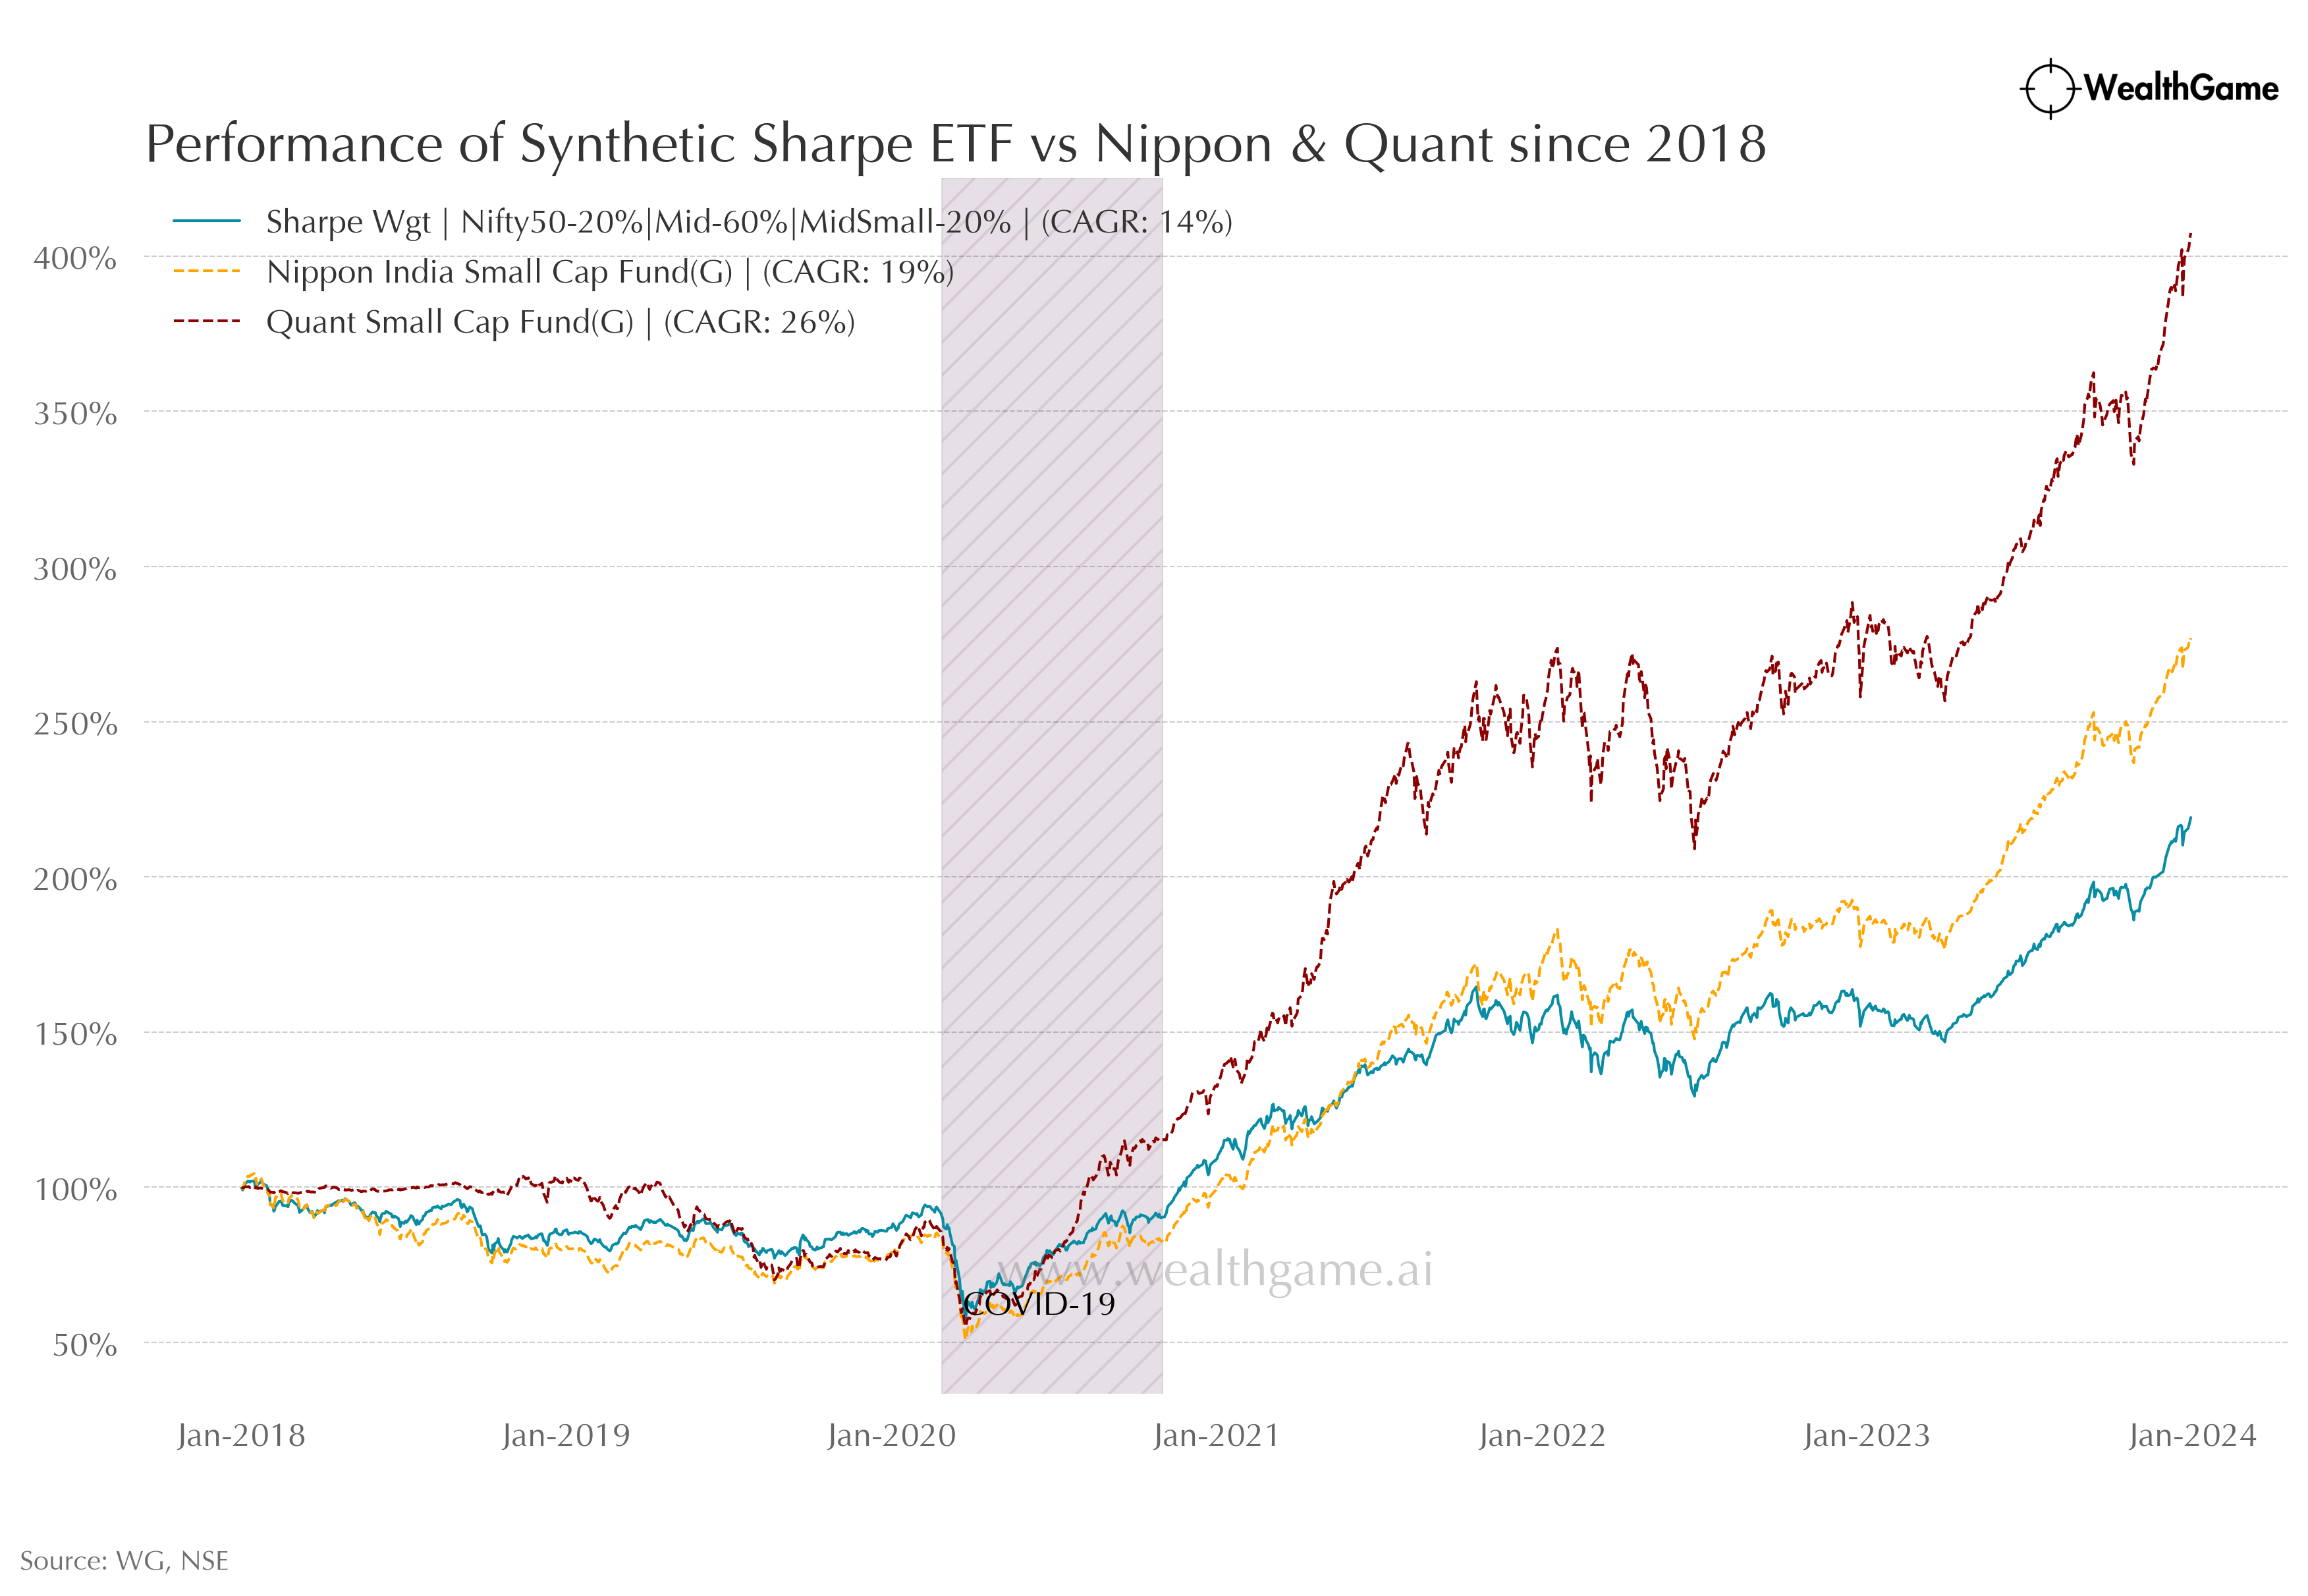
Moving on, in adherence to my initial hypothesis, I crafted synthetic indices ETFs, distributing equal weights across Nifty 50, Nifty Midcap 150, and Nifty MidSmallcap 400. Additionally, with a hindsight bias, I optimized portfolio weights to maximize risk-adjusted returns (Sharpe ratio), resulting in a distribution of 20%, 60%, and 20% across the indices respectively.
Relative performance of the chosen Nifty Indices
Challenging my hypothesis both Nippon and Quant Smallcap schemes significantly outperformed equal-weight synthetic etf:
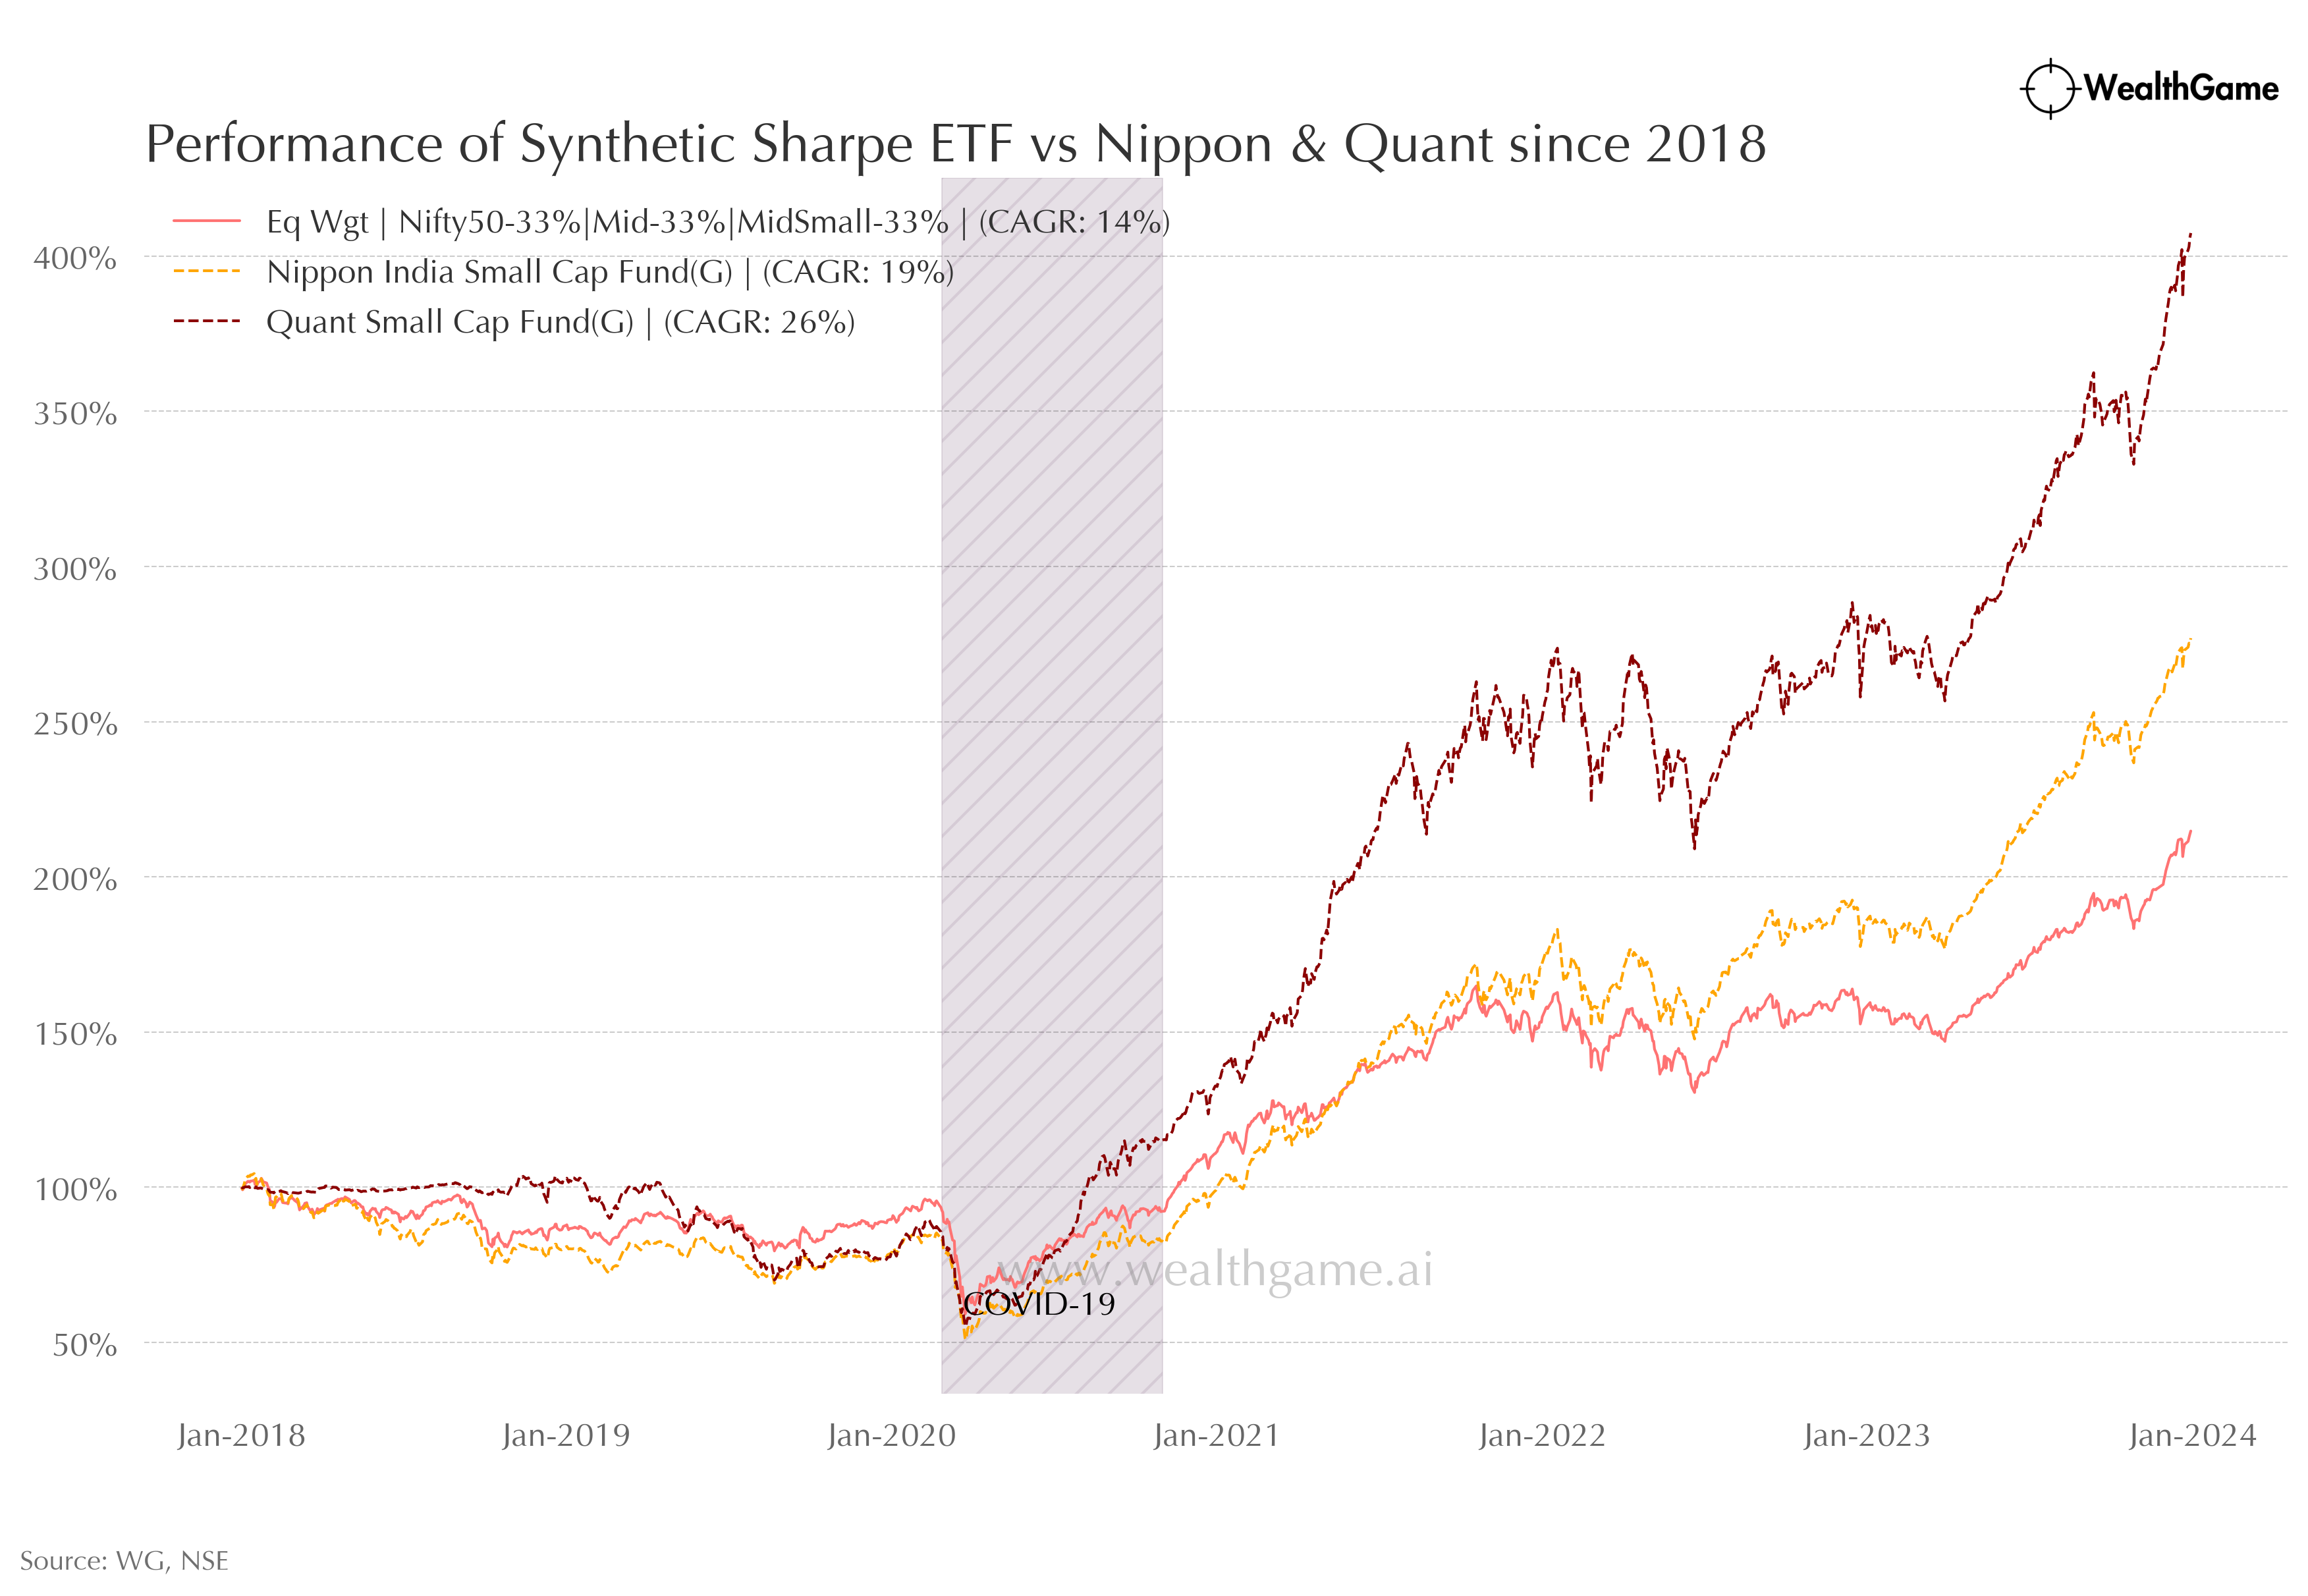
Sharpe-weighted synthetic ETF’s performance
Conclusion:
The data tells a compelling story. While the appeal of high-performing mutual funds may draw us in, our analysis confirms that past success doesn't guarantee future performance. However, despite my own biases, both Nippon Smallcap and Quant Smallcap have consistently outperformed the equal-weighted ETF or optimized ETF strategy since 2018. Even when examining different time frames, the results remain notably consistent, instilling confidence in the exceptional strategies employed by both fund managers. That said, the crux lies in your confidence in fund selection. If you're certain about your choice, feel free to proceed with your preferred scheme; otherwise, synthetic ETFs present a viable alternative.
Regulatory Disclaimer: The views expressed herein are solely my own and have not been influenced by external factors or remuneration.
Annex:
Yearly Point 2 Point Returns of MF schemes: